Area guide
Flushing real estate guide
Flushing core · Queens · ZIP 11354 & 11355
Explore Flushing one property at a time. Compare ownership, building costs and the places you use every day, then plan your next move with our local team.
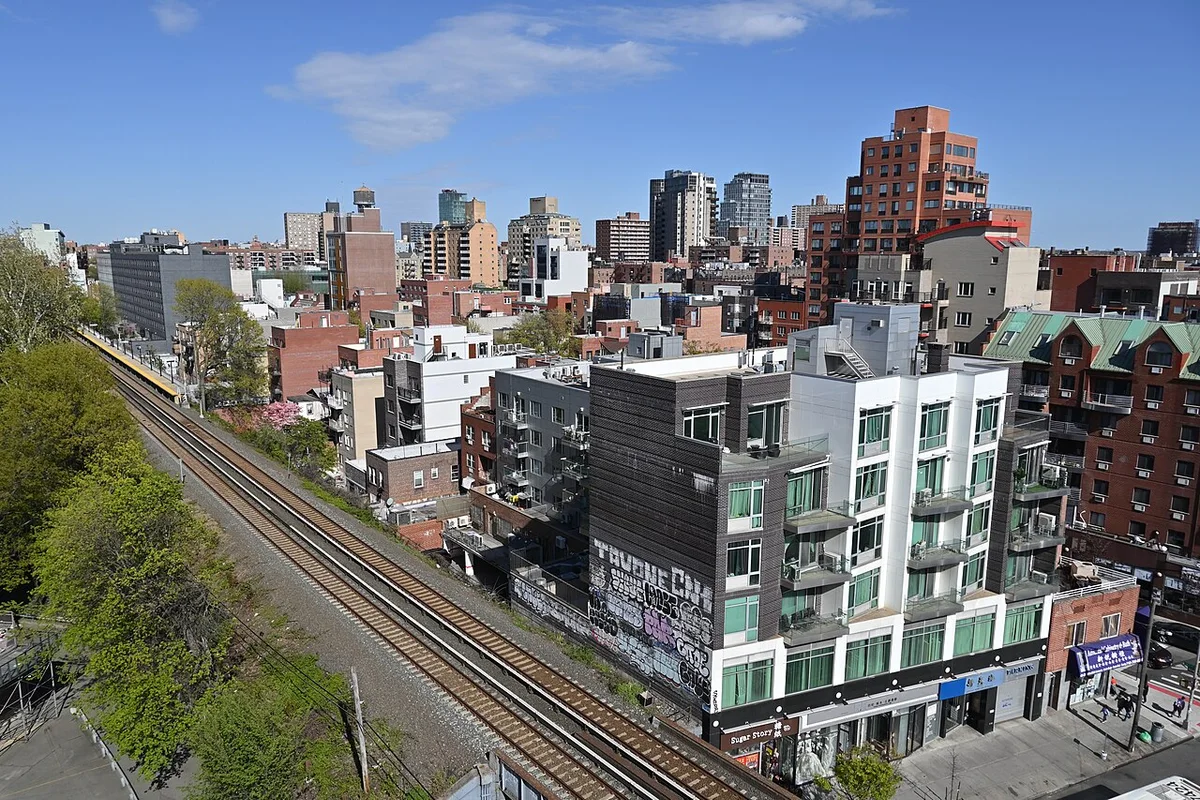
Your next move in Flushing
Explore Flushing one property at a time. Compare ownership, building costs and the places you use every day, then plan your next move with our local team.
Flushing core · Queens · ZIP 11354 & 11355. This reporting scope does not represent every part of Flushing.
Homes for sale in Flushing
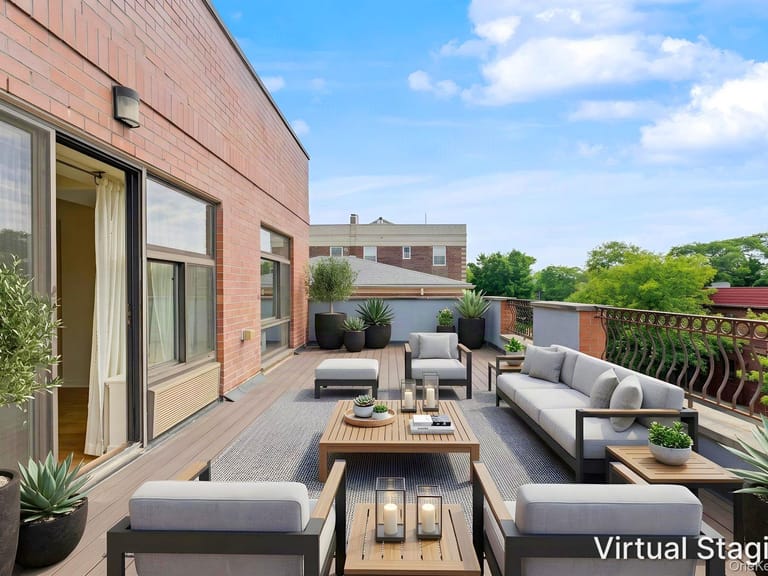
Condo
41-39 149TH ST #3F
$838,0002 beds · 2 baths
Listing courtesy of B Square Realty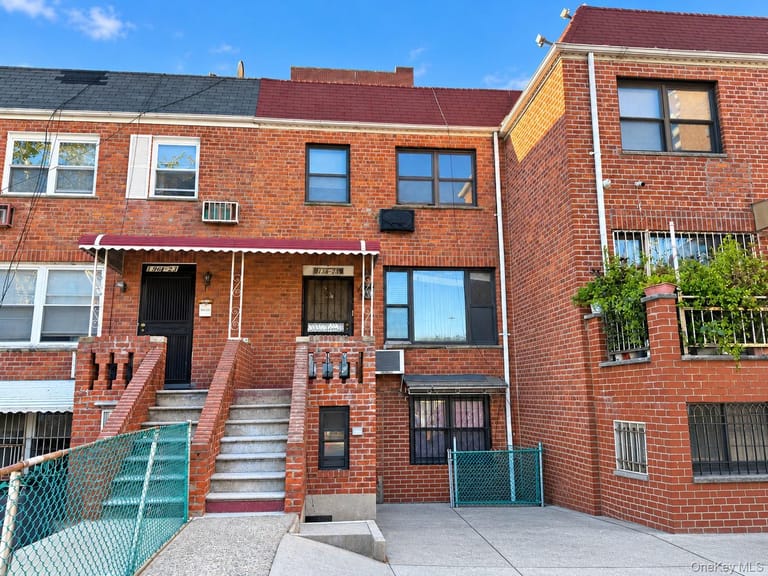
Duplex
136-25 Cherry Avenue
$1,790,0006 beds · 3 baths
Listing courtesy of B Square Realty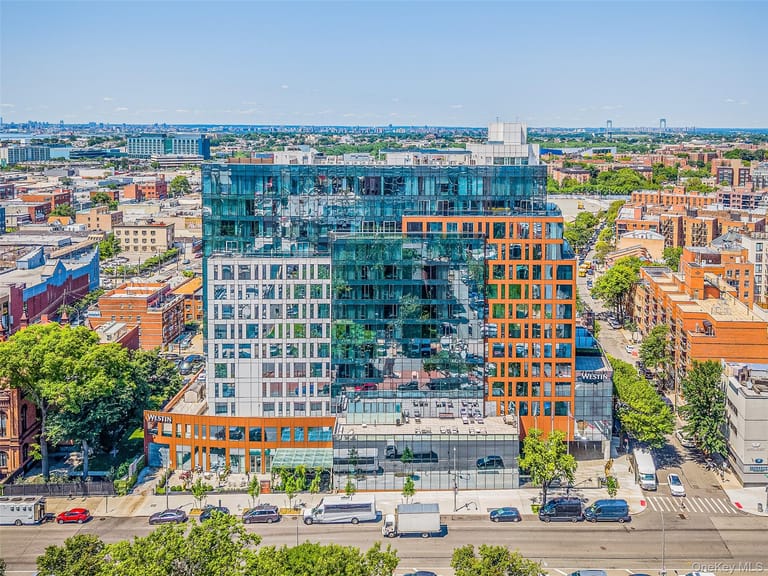
Condo
35-32 Leavitt Street #12B
$895,0001 beds · 1 baths
Listing courtesy of B Square Realty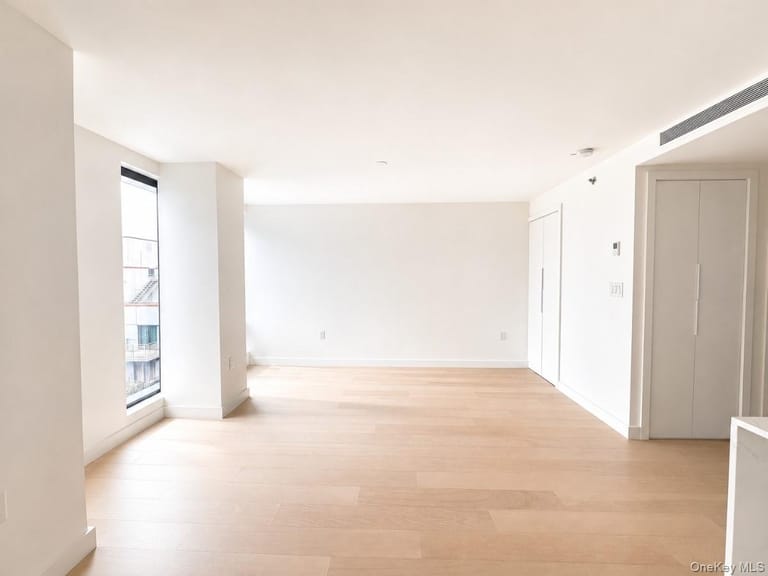
Condo
144-49 Northern Boulevard #722
$535,2000 beds · 1 baths
Listing courtesy of B Square Realty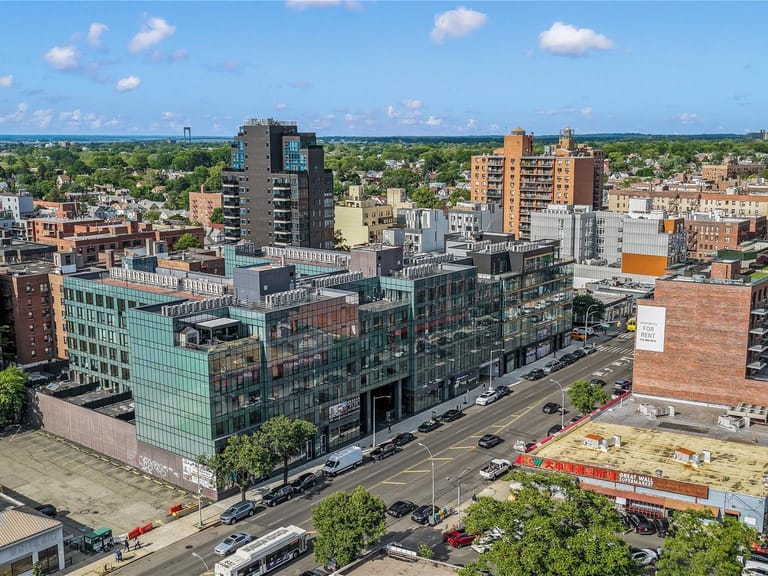
Condo
144-49 Northern Boulevard #713
$1,248,1002 beds · 2 baths
Listing courtesy of B Square Realty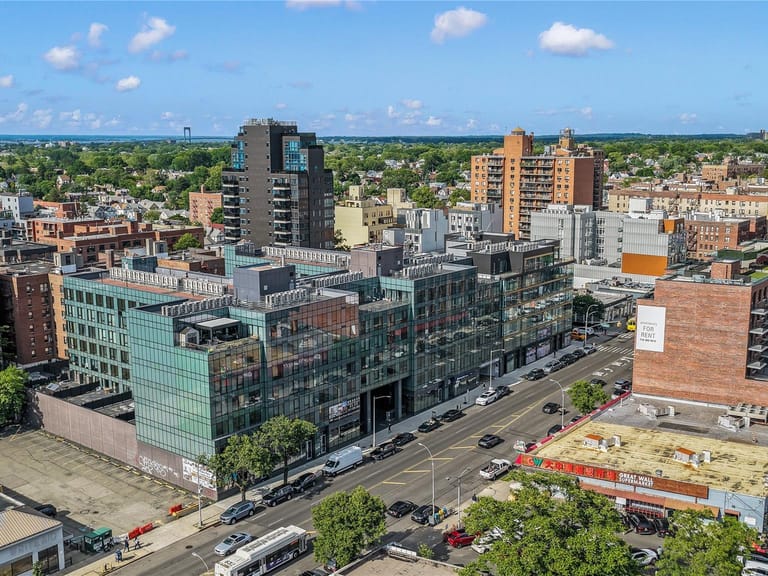
Condo
144-49 Northern Boulevard #629
$957,6002 beds · 2 baths
Listing courtesy of B Square RealtyMarket snapshot
2026-09 · All Residential
- Median sale price
- $576,661
- Recorded sales (synced sample)
- 56
- Current active inventory
- —
- Median days on market
- 61.5 days
- Sale / original asking
- 95.6%
- Above original asking
- 8.9%
- Average sale price
- $613,685
- Recorded sale volume
- $34,366,373
- Average days on market
- 70.4 days
- Month-end active inventory
- —
- New listings
- —
- Months of supply
- —
Same month last year $567,545
YoY +1.6%
56 observations
Same month last year 56
YoY 0.0%
56 observations
Data is not ready for this statistic
Same month last year 58 days
56 observations
Same month last year 95.8%
YoY -0.2 pp
56 observations
Same month last year 5.4%
YoY +3.6 pp
56 observations
Same month last year $637,864
YoY -3.8%
56 observations
Same month last year $35,720,373
YoY -3.8%
56 observations
Same month last year 77.4 days
56 observations
A complete historical month-end inventory is unavailable
Complete historical listing entries are unavailable
A complete historical month-end inventory is unavailable
Monthly and trailing 12-month comparison
| Metric | 2026-09 | Same month last year2025-09 | Trailing 12 months2025-10 – 2026-09 | Previous 12 months2024-10 – 2025-09 |
|---|---|---|---|---|
| Median sale price | $576,661 | $567,545 | $629,665 | $571,520 |
| Recorded sales (synced sample) | 56 | 56 | 759 | 719 |
| Median days on market | 61.5 days | 58 days | 52 days | 71 days |
| Sale / original asking | 95.6% | 95.8% | 95.7% | 95.2% |
| Above original asking | 8.9% | 5.4% | 12.6% | 7.9% |
| Average sale price | $613,685 | $637,864 | $668,945 | $619,909 |
| Recorded sale volume | $34,366,373 | $35,720,373 | $507,729,490 | $445,714,256 |
| Average days on market | 70.4 days | 77.4 days | 78.2 days | 99.5 days |
Trailing periods pool all eligible sales: counts and volume are totals; means and medians use individual sales, never an average of monthly medians. A dash indicates insufficient samples or coverage.
2026-09: median sale price $576,661; 56 closed sales. Synced OneKey MLS sample; not a certified full-market total.
MLS snapshot 2026-10-22T15:52:36.859Z · Generated 2026-10-22T15:54:55.002Z
Scope & methodology
Queens County ZIP codes 11354, 11355
Median sale price: Median positive close price, USD
Recorded sales (synced sample): Unique transactions in the synced sample; not a certified full-market total
Current active inventory: Active inventory observed 2026-10-22T15:54:55.001Z; not historical month end
Median days on market: Explicit MLS DaysOnMarket; zero is valid
Sale / original asking: Median per-sale close/original price, percent
Above original asking: Share of valid price pairs closing above original asking
Average sale price: Arithmetic mean of positive close prices, USD
Recorded sale volume: Sum of valid positive close prices; excludes missing prices, not an estimate
Average days on market: Arithmetic mean of explicit MLS DaysOnMarket; zero is valid
Month-end active inventory: Active listings at the end of the selected month; requires a verified historical snapshot
New listings: Distinct MLS listing entries during the selected month, including subsequently off-market listings
Months of supply: Month-end active inventory divided by sales in that month; unavailable without historical inventory or with zero sales
Different homes. Different questions.
Compare the unit and the building
Review common charges, taxes, assessments, building condition and current rules.
Understand the ownership and approval process
Ask about maintenance, building financials, financing requirements and purchase approval.
Plan for the property as a whole
Compare the building, land, inspection findings and likely maintenance needs.
Review the property and the records
Confirm legal unit configuration, occupancy, expenses and your intended use.
Explore life around your address
Transit connections
Check subway and rail maps, service updates and a route from the actual property address.
Flushing Meadows Corona Park
Explore park facilities and current activities through NYC Parks.
Library & local services
Look up library locations, services and opening hours before a visit.
Everyday shopping
Use the map to explore Main Street and check the businesses near a specific address.
Recent Flushing transactions — B Square Realty
Residential transactions in the past 12 months where our company represented the buyer or seller.
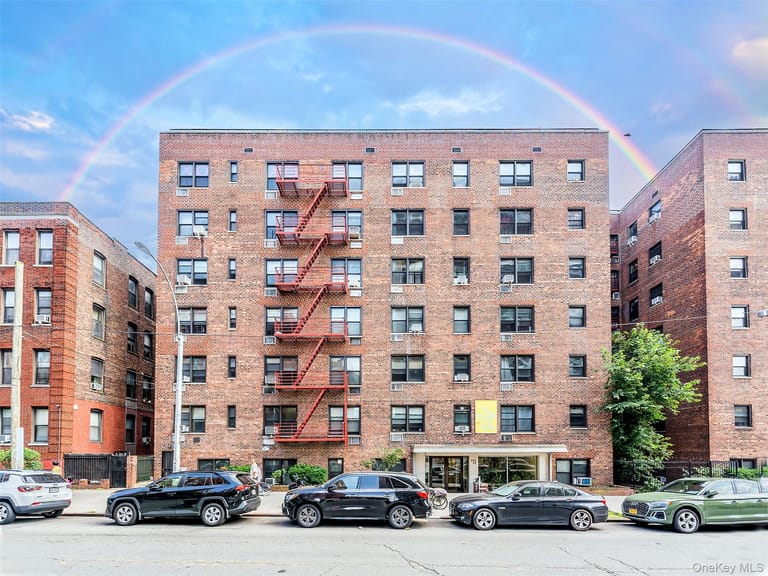
Buyer & seller represented
Address withheld
$469,000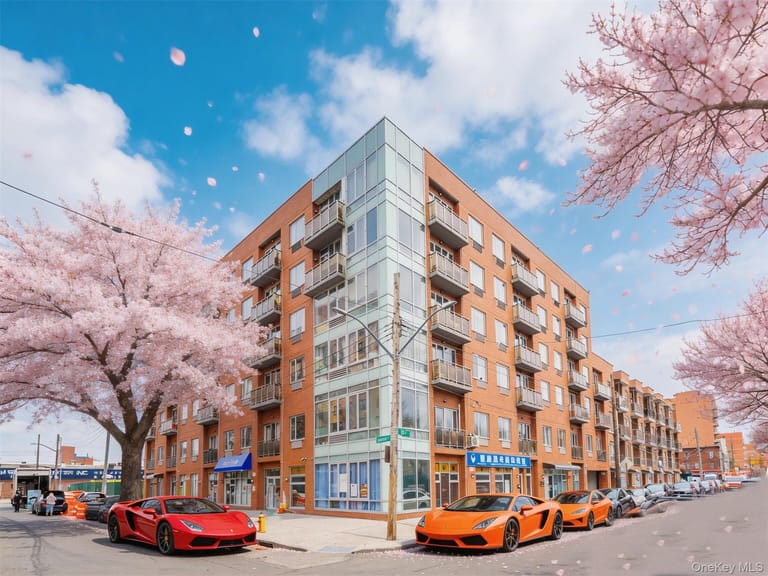
Buyer & seller represented
Address withheld
$618,880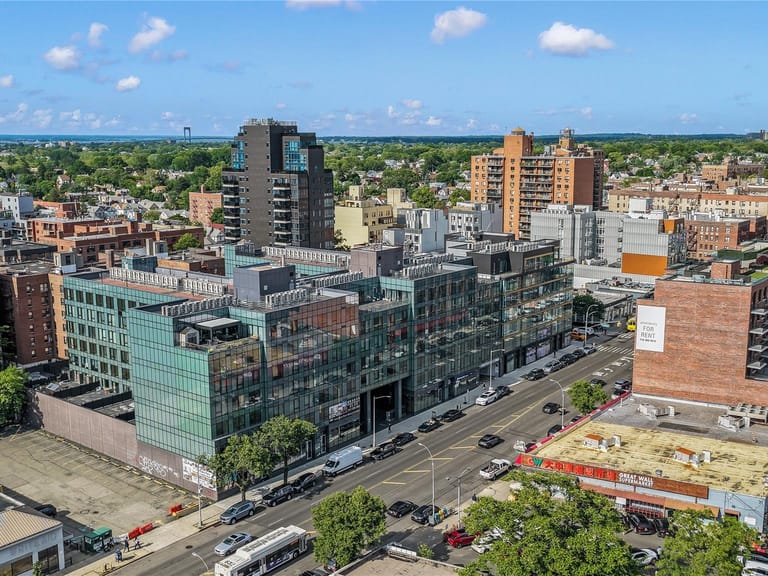
Buyer & seller represented
Address withheld
$830,000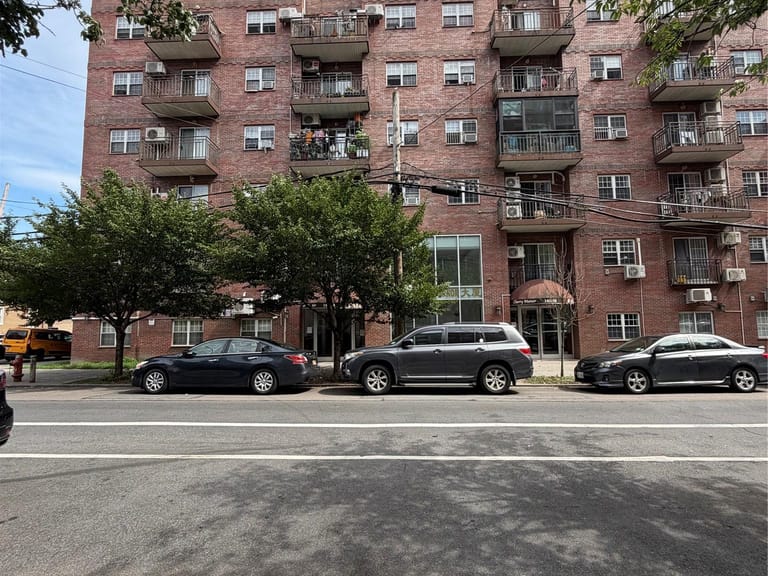
Seller represented
Address withheld
$510,000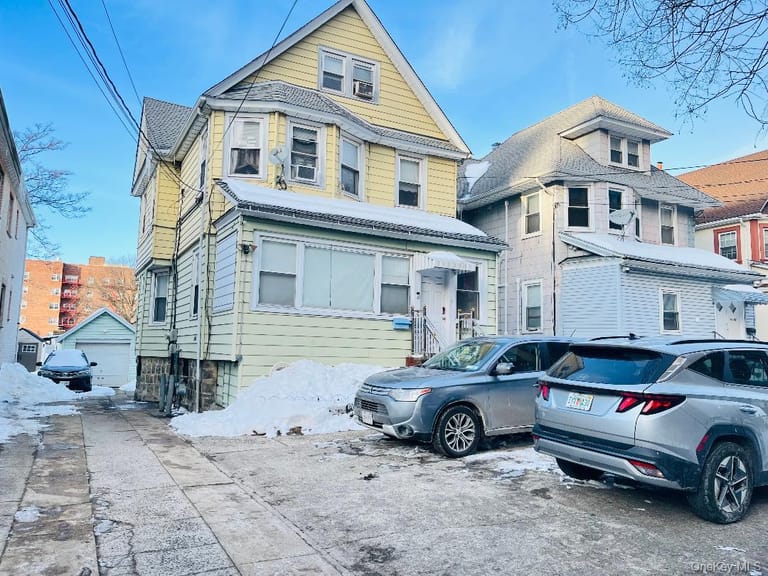
Buyer represented
Address withheld
$1,325,000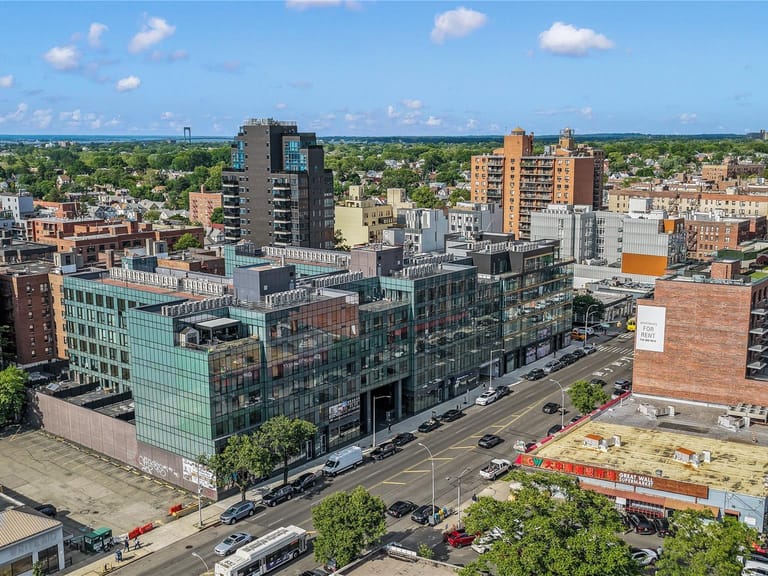
Seller represented
Address withheld
$868,860Start with your property and your plans
01
Share the address, property type and timing
02
Review comparable sales and current competition
03
Prepare documents and plan the next steps
People to guide your next move
Questions before your next move
What area does this page cover?
Flushing core · Queens · ZIP 11354 & 11355; this does not cover every part of Flushing.
Are all homes represented by B Square Realty?
The default selection shows company listings. All area listings also includes public listings from other brokerages with listing attribution.
Do company transactions describe the whole market?
Company transactions show our representation experience. Market reports use a separate regional residential sample.
What should I prepare for a conversation?
For buying, share your budget, property preferences and timing. For selling, share the address, property type, recurring costs and timing.