Jackson Heights
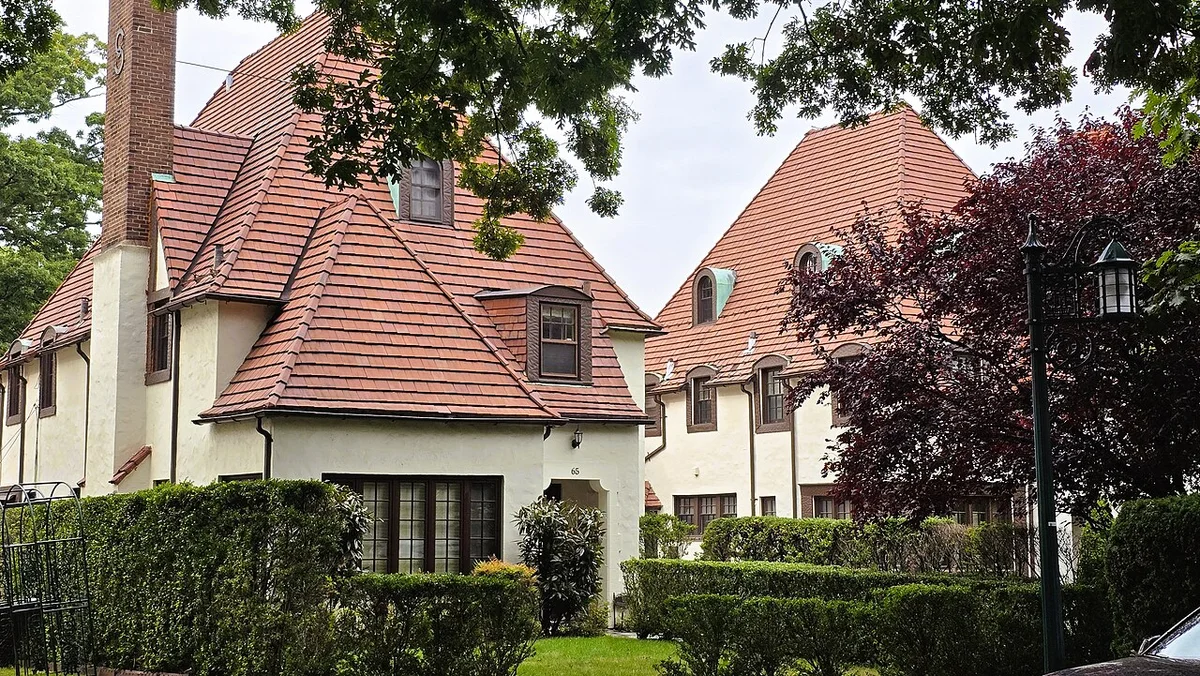
A closer look at the block
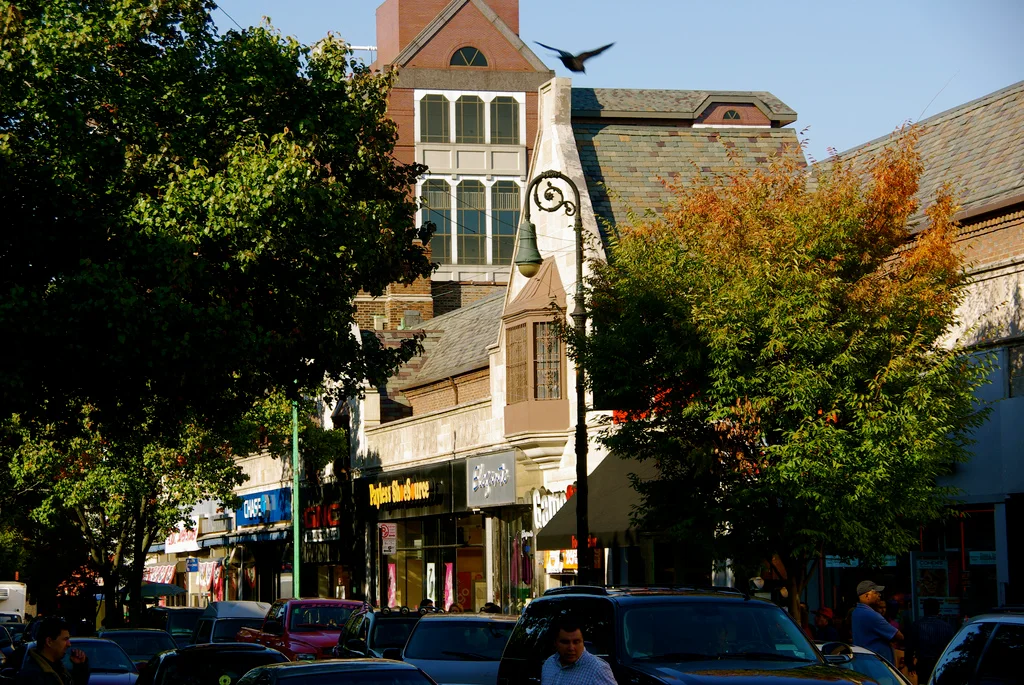
Get to know Jackson Heights
Walk the residential blocks around 37th Avenue and compare the buildings, shops and routes near homes on your shortlist.
Review co-op financials and sublet rules. Confirm any landmark restrictions for the specific property.
Market snapshot
2026-10 · All Residential
- Median sale price
- $244,500
- Recorded sales (synced sample)
- 16
- Current active inventory
- —
- Median days on market
- 100.5 days
- Sale / original asking
- 97.3%
- Above original asking
- 25.0%
- Average sale price
- $378,477
- Recorded sale volume
- $6,055,630
- Average days on market
- 150.4 days
- Month-end active inventory
- —
- New listings
- —
- Months of supply
- —
Same month last year $485,000
YoY -49.6%
16 observations
Same month last year 15
YoY +6.7%
16 observations
Data is not ready for this statistic
Same month last year 82 days
16 observations
Same month last year 95.6%
YoY +1.7 pp
16 observations
Same month last year 13.3%
YoY +11.7 pp
16 observations
Same month last year $529,600
YoY -28.5%
16 observations
Same month last year $7,944,000
YoY -23.8%
16 observations
Same month last year 111.1 days
16 observations
A complete historical month-end inventory is unavailable
Complete historical listing entries are unavailable
A complete historical month-end inventory is unavailable
Monthly and trailing 12-month comparison
| Metric | 2026-10 | Same month last year2025-10 | Trailing 12 months2025-11 – 2026-10 | Previous 12 months2024-11 – 2025-10 |
|---|---|---|---|---|
| Median sale price | $244,500 | $485,000 | $349,000 | $386,500 |
| Recorded sales (synced sample) | 16 | 15 | 171 | 180 |
| Median days on market | 100.5 days | 82 days | 92 days | 87 days |
| Sale / original asking | 97.3% | 95.6% | 96.6% | 96.1% |
| Above original asking | 25.0% | 13.3% | 16.4% | 15.6% |
| Average sale price | $378,477 | $529,600 | $429,954 | $495,209 |
| Recorded sale volume | $6,055,630 | $7,944,000 | $73,522,130 | $89,137,662 |
| Average days on market | 150.4 days | 111.1 days | 114.9 days | 109.5 days |
Trailing periods pool all eligible sales: counts and volume are totals; means and medians use individual sales, never an average of monthly medians. A dash indicates insufficient samples or coverage.
2026-10: median sale price $244,500; 16 closed sales. Synced OneKey MLS sample; not a certified full-market total.
MLS snapshot 2026-11-01T11:18:36.648Z · Generated 2026-11-01T11:22:17.607Z
Scope & methodology
Jackson Heights: ZIP 11372; configured search, not an administrative boundary
Median sale price: Median positive close price, USD
Recorded sales (synced sample): Unique transactions in the synced sample; not a certified full-market total
Current active inventory: Active inventory observed 2026-11-01T11:22:17.607Z; not historical month end
Median days on market: Explicit MLS DaysOnMarket; zero is valid
Sale / original asking: Median per-sale close/original price, percent
Above original asking: Share of valid price pairs closing above original asking
Average sale price: Arithmetic mean of positive close prices, USD
Recorded sale volume: Sum of valid positive close prices; excludes missing prices, not an estimate
Average days on market: Arithmetic mean of explicit MLS DaysOnMarket; zero is valid
Month-end active inventory: Active listings at the end of the selected month; requires a verified historical snapshot
New listings: Distinct MLS listing entries during the selected month, including subsequently off-market listings
Months of supply: Month-end active inventory divided by sales in that month; unavailable without historical inventory or with zero sales
Take the next step beyond the map.
A place to start
37th Avenue, Jackson Heights, Queens
Open mapPlan the actual journey
Check stations, routes and current service from the property address.
Explore MTA mapsCompare individual homes
Explore current results and refine by budget and property type. Listing search may cover a different scope from the snapshot.
Search homesYour next move in Jackson Heights
Tell us your budget, property preferences and timing. We’ll discuss the right support and next steps with you.
Keep exploring
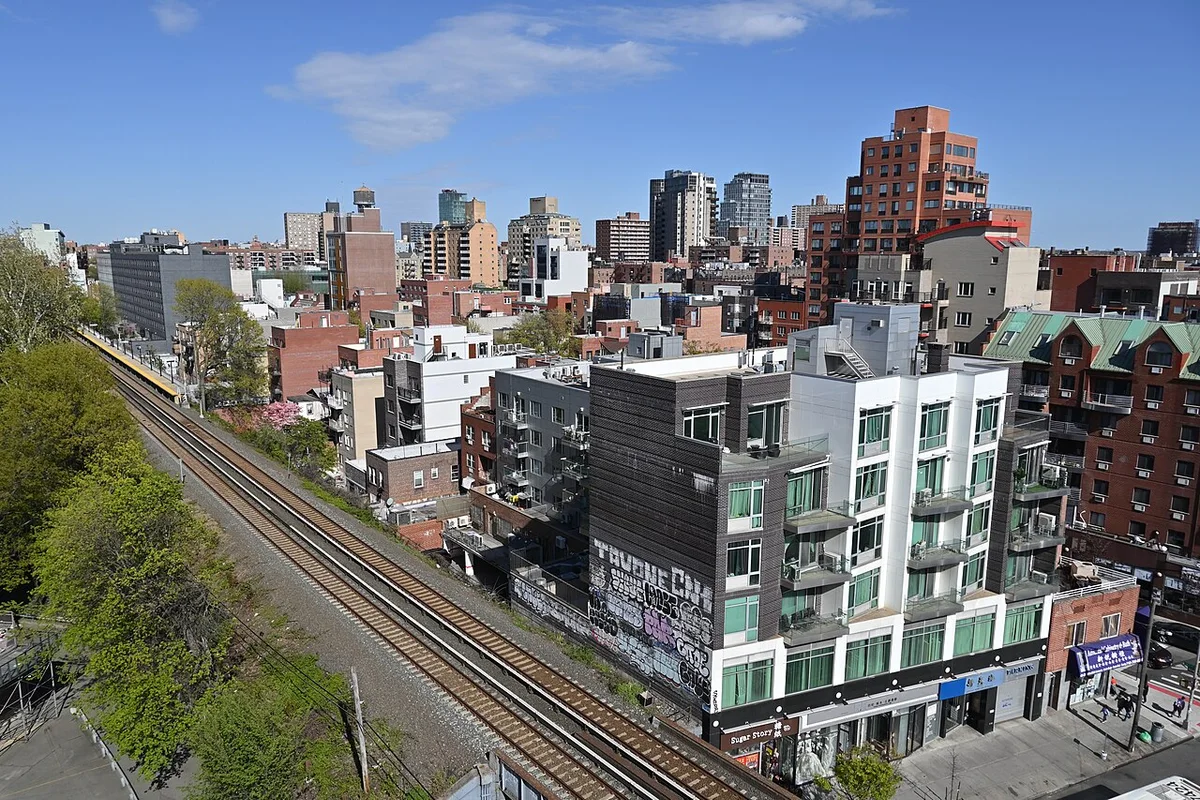
Flushing
Main Street & beyond
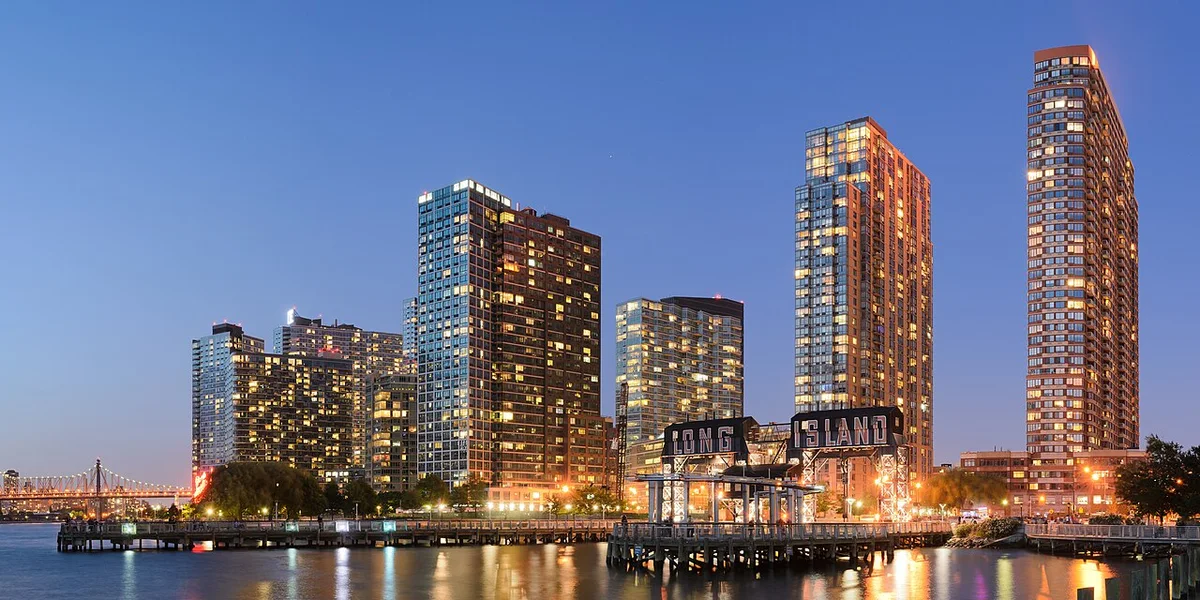
Long Island City
An East River perspective
Forest Hills
Around Austin Street